MomentumSignal Kit RSI-MACD-ADX-CCI-CMF-TSI-EStoch// ----------------------------------------
// Description:
// ----------------------------------------
// MomentumKit RSI/MACD-ADX-CCI-CMF-TSI-EStoch Suite is a comprehensive momentum indicator suite designed to provide robust buy and sell signals through the consensus of multiple normalized momentum indicators. This suite integrates the following indicators:
// - **Relative Strength Index (RSI)**
// - **Stochastic RSI**
// - **Moving Average Convergence Divergence (MACD)** with enhanced logic
// - **True Strength Index (TSI)**
// - **Commodity Channel Index (CCI)**
// - **Chaikin Money Flow (CMF)**
// - **Average Directional Index (ADX)**
// - **Ehlers' Stochastic**
//
// **Key Features:**
// 1. **Normalization:** Each indicator is normalized to a consistent scale, facilitating easier comparison and interpretation across different momentum metrics. This uniform scaling allows traders to seamlessly analyze multiple indicators simultaneously without the confusion of differing value ranges.
//
// 2. **Consensus-Based Signals:** By combining multiple indicators, MomentumKit generates buy and sell signals based on the agreement among various momentum measurements. This multi-indicator consensus approach enhances signal reliability and reduces the likelihood of false positives.
//
// 3. **Overlap Analysis:** The normalization process aids in identifying overlapping signals, where multiple indicators point towards a potential change in price or momentum. Such overlaps are strong indicators of significant market movements, providing traders with timely and actionable insights.
//
// 4. **Enhanced Logic for MACD:** The MACD component within MomentumKit utilizes enhanced logic to improve its responsiveness and accuracy in detecting trend changes.
//
// 5. **Debugging Features:** MomentumKit includes advanced debugging tools that display individual buy and sell signals generated by each indicator. These features are intended for users with technical and programming skills, allowing them to:
// - **Visualize Signal Generation:** See real-time buy and sell signals for each integrated indicator directly on the chart.
// - **Adjust Signal Thresholds:** Modify the criteria for what constitutes a buy or sell signal for each indicator, enabling tailored analysis based on specific trading strategies.
// - **Filter and Manipulate Signals:** Enable or disable specific indicators' contributions to the overall buy and sell signals, providing flexibility in signal generation.
// - **Monitor Indicator Behavior:** Utilize debug plots and labels to understand how each indicator reacts to market movements, aiding in strategy optimization.
//
// **Work in Progress:**
// MomentumKit is continuously evolving, with ongoing enhancements to its algorithms and user interface. Current debugging features are designed to offer deep insights for technically adept users, allowing for extensive customization and fine-tuning. Future updates aim to introduce more user-friendly interfaces and automated optimization tools to cater to a broader audience.
//
// **Usage Instructions:**
// - **Visibility Controls:** Users can toggle the visibility of individual indicators to focus on specific momentum metrics as needed.
// - **Parameter Adjustments:** Each indicator comes with customizable parameters, allowing traders to fine-tune the suite according to their trading strategies and market conditions.
// - **Debugging Features:** Enable the debugging mode to visualize individual indicator signals and adjust their contribution to the overall buy/sell signals. This requires a basic understanding of the underlying indicators and their operational thresholds.
//
// **Benefits:**
// - **Simplified Analysis:** Normalization simplifies the process of analyzing multiple indicators, making it easier to identify consistent signals across different momentum measurements.
// - **Improved Decision-Making:** Consensus-based signals backed by multiple normalized indicators provide a higher level of confidence in trading decisions.
// - **Versatility:** Suitable for various trading styles and market conditions, MomentumKit offers a versatile toolset for both novice and experienced traders.
//
// **Technical Requirements:**
// - **Programming Knowledge:** To fully leverage the debugging and signal manipulation features, users should possess a foundational understanding of Pine Script and the mechanics of momentum indicators.
// - **Customization Skills:** Ability to adjust indicator parameters and debug filters to align with specific trading strategies.
//
// **Disclaimer:**
// This indicator suite is intended for educational and analytical purposes only and does not constitute financial advice. Trading involves significant risk, and past performance is not indicative of future results. Always conduct your own analysis or consult a qualified financial advisor before making trading decisions.
스크립트에서 "Relative Strength Index (RSI)"에 대해 찾기

Balance of Power [SYNC & TRADE]Balance of Power
Overview
This indicator analyzes the balance of power between buyers and sellers in the market. It uses volume, price action and the relative strength index (RSI) to determine the strength of buyers and sellers, as well as to identify potential zones where one side dominates the other.
How it works
The indicator calculates the average volume over a specified period.
It determines the strength of each bar, taking into account volume and price action.
RSI is used as an additional factor to assess the strength of the trend.
Based on these factors, the "balance of power" between buyers and sellers is calculated.
When the balance of power exceeds a specified threshold, the indicator marks the beginning of the "buyer zone" or "seller zone".
How to use
Add the indicator to your chart in TradingView.
Configure the input parameters:
"Period for average volume": determines the sensitivity to volume changes.
"RSI period": affects the sensitivity of the RSI to price changes.
"Strength threshold": sets the level for determining a significant imbalance.
"Table Size": select the appropriate size of the information table.
Observe the signals on the chart:
Blue triangle up: the beginning of the buyer zone.
Red triangle down: the beginning of the seller zone.
Use the information table to get additional data:
Current balance of power
Buyers or sellers have strength
Current RSI value
Advantages
Comprehensive analysis of market conditions
Visual signals for potential entry points
Customizable parameters to adapt to different trading styles
Informative table for quick analysis of the current situation
Limitations
Like any indicator, it can give false signals
Requires additional analysis and confirmation with other tools
Efficiency may vary depending on market conditions
Recommendations
Use this indicator in combination with other analysis methods to make trading decisions. Experiment with the settings to optimize for your trading style and selected assets.
Balance of Power Ru
Обзор
Этот индикатор анализирует баланс сил между покупателями и продавцами на рынке. Он использует объем, ценовое движение и индекс относительной силы (RSI) для определения силы покупателей и продавцов, а также для выявления потенциальных зон, где одна сторона доминирует над другой.
Как это работает
Индикатор рассчитывает среднее значение объема за указанный период.
Он определяет силу каждого бара, учитывая объем и ценовое движение.
RSI используется как дополнительный фактор для оценки силы тренда.
На основе этих факторов вычисляется "баланс сил" между покупателями и продавцами.
Когда баланс сил превышает заданный порог, индикатор отмечает начало "зоны покупателей" или "зоны продавцов".
Как использовать
Добавьте индикатор на ваш график в TradingView.
Настройте входные параметры:
"Период для среднего объема": определяет чувствительность к изменениям объема.
"Период RSI": влияет на чувствительность RSI к ценовым изменениям.
"Порог силы": устанавливает уровень для определения значимого дисбаланса.
"Размер таблицы": выберите подходящий размер информационной таблицы.
Наблюдайте за сигналами на графике:
Синий треугольник вверх: начало зоны покупателей.
Красный треугольник вниз: начало зоны продавцов.
Используйте информационную таблицу для получения дополнительных данных:
Текущий баланс сил
Наличие силы у покупателей или продавцов
Текущее значение RSI
Преимущества
Комплексный анализ рыночных условий
Визуальные сигналы для потенциальных точек входа
Настраиваемые параметры для адаптации к разным торговым стилям
Информативная таблица для быстрого анализа текущей ситуации
Ограничения
Как и любой индикатор, может давать ложные сигналы
Требует дополнительного анализа и подтверждения другими инструментами
Эффективность может варьироваться в зависимости от рыночных условий
Рекомендации
Используйте этот индикатор в сочетании с другими методами анализа для принятия торговых решений. Экспериментируйте с настройками для оптимизации под ваш торговый стиль и выбранные активы.

Uptrick: Crypto Volatility Index** Crypto Volatility Index(VIX) **
Overview
The Crypto Volatility Index (VIX) is a specialized technical indicator designed to measure the volatility of cryptocurrency prices. Leveraging advanced statistical methods, including logarithmic returns and variance, the Crypto VIX offers a refined measure of market fluctuations. This approach makes it particularly useful for traders in the highly volatile cryptocurrency market, providing insights that traditional volatility indicators may not capture as effectively.
Purpose
The Crypto VIX aims to deliver a nuanced understanding of market volatility, tailored specifically for the cryptocurrency space. Unlike other volatility measures, the Crypto VIX employs sophisticated statistical methods to reflect the unique characteristics of cryptocurrency price movements. This makes it especially valuable for cryptocurrency traders, helping them navigate the inherent volatility of digital assets and manage their trading strategies and risk exposure more effectively.
Calculation
1. Indicator Declaration
The Crypto VIX is plotted in a separate pane below the main price chart for clarity:
indicator("Crypto Volatility Index (VIX)", overlay=false, shorttitle="Crypto VIX")
2. Input Parameters
Users can adjust the period length for volatility calculations:
length = input.int(14, title="Period Length")
3. Calculating Daily Returns
The daily returns are calculated using logarithmic returns:
returns = math.log(close / close )
- **Logarithmic Returns:** These returns provide a normalized measure of price changes, making it easier to compare returns over different periods and across different assets.
4. Average Return Calculation
The average return over the specified period is computed with a Simple Moving Average (SMA):
avg_return = ta.sma(returns, length)
5. Variance Calculation
Variance measures the dispersion of returns from the average:
variance = ta.sma(math.pow(returns - avg_return, 2), length)
- Variance : This tells us how much the returns deviate from the average, giving insight into how volatile the market is.
6. Standard Deviation (Volatility) Calculation
Volatility is derived as the square root of the variance:
volatility = math.sqrt(variance)
- Standard Deviation : This provides a direct measure of volatility, showing how much the price typically deviates from the mean return.
7. Plotting the Indicator
The volatility and average return are plotted:
plot(volatility, color=#21f34b, title="Volatility Index")
plot(avg_return, color=color.new(color.red, 80), title="Average Return", style=plot.style_columns)
Practical Examples
1. High Volatility Scenario
** Example :** During significant market events, such as major regulatory announcements or geopolitical developments, the Crypto VIX tends to rise sharply. For instance, if the Crypto VIX moves from a baseline level of 0.2 to 0.8, it indicates heightened market volatility. Traders might see this as a signal to adjust their strategies, such as reducing position sizes or setting tighter stop-loss levels to manage increased risk.
2. Low Volatility Scenario
** Example :** In a stable market, where prices fluctuate within a narrow range, the Crypto VIX will show lower values. For example, a drop in the Crypto VIX from 0.4 to 0.2 suggests lower volatility and stable market conditions. Traders might use this information to consider longer-term trades or take advantage of potential consolidation patterns.
Best Practices
1. Combining Indicators
- Moving Averages : Use the Crypto VIX with moving averages to identify trends and potential reversal points.
- Relative Strength Index (RSI): Combine with RSI to assess overbought or oversold conditions for better entry and exit points.
- Bollinger Bands : Pair with Bollinger Bands to understand volatility relative to price movements and spot potential breakouts.
2. Adjusting Parameters
- Short-Term Trading : Use a shorter period length (e.g., 7 days) to capture rapid volatility changes suitable for day trading.
- Long-Term Investing : A longer period length (e.g., 30 days) provides a smoother view of volatility, helping long-term investors navigate market trends.
Backtesting and Performance Insights
While specific backtesting data for the Crypto VIX is not yet available, the indicator is built on established principles of volatility measurement, such as logarithmic returns and standard deviation. These methods are well-regarded in financial analysis for accurately reflecting market volatility. The Crypto VIX is designed to offer insights similar to other effective volatility indicators, tailored specifically for the cryptocurrency markets. Its adaptation to digital assets and ability to provide precise volatility measures underscore its practical value for traders.
Originality and Uniqueness
The Crypto Volatility Index (VIX) distinguishes itself through its specialized approach to measuring volatility in the cryptocurrency markets. While the concepts of logarithmic returns and standard deviation are not new, the Crypto VIX integrates these methods into a unique framework designed specifically for digital assets.
- Tailored Methodology : Unlike generic volatility indicators, the Crypto VIX is adapted to the unique characteristics of cryptocurrencies, providing a more precise measure of price fluctuations that reflects the inherent volatility of digital markets.
- Enhanced Insights : By focusing on cryptocurrency-specific price behavior and incorporating advanced statistical techniques, the Crypto VIX offers insights that traditional volatility indicators might miss. This makes it a valuable tool for traders navigating the complex and fast-moving cryptocurrency landscape.
- Innovative Application : The Crypto VIX combines established financial metrics in a novel way, offering a fresh perspective on market volatility and contributing to more effective risk management and trading strategies in the cryptocurrency space.
Summary
The Crypto Volatility Index (VIX) is a specialized tool for measuring cryptocurrency market volatility. By utilizing advanced statistical methods such as logarithmic returns and standard deviation, it provides a detailed measure of price fluctuations. While not entirely original in its use of these methods, the Crypto VIX stands out through its tailored application to the unique characteristics of the cryptocurrency market. Traders can use the Crypto VIX to gauge market risk, adjust their strategies, and make informed trading decisions, supported by practical examples, best practices, and clear visual aids.

RSI Overlay Table - 30 Tickers Sorted with ColorOverview
The RSI Overlay Table script provides traders with a powerful tool to monitor the Relative Strength Index (RSI) across multiple tickers in real-time. This script enables users to keep track of up to 30 different assets simultaneously, displaying their RSI values in an easy-to-read table format directly on the chart. It helps traders identify overbought and oversold conditions quickly, enhancing their ability to make informed trading decisions.
Key Features
Monitor Multiple Tickers: Track the RSI values of up to 30 different tickers at once. This allows users to have a broad view of market conditions across various assets without the need to switch between charts.
Dynamic RSI Calculations: The script calculates the RSI using the user-defined length, providing flexibility to adjust sensitivity based on the trading strategy. The default RSI length is set to 14, a commonly used period in technical analysis.
Customizable Overbought and Oversold Levels: Users can define their own overbought and oversold RSI levels, allowing them to tailor the script to their trading style. By default, the overbought level is set at 70, and the oversold level is set at 30.
Hide Neutral Rows Option: To help traders focus on the most critical signals, the script includes an option to hide rows where the RSI values are neither overbought nor oversold. This feature helps traders concentrate on assets that are more likely to experience a price reversal.
Color-Coded Alerts: The script highlights overbought and oversold conditions with distinct colors:
Red: Indicates that the asset is overbought (RSI above the user-defined overbought level).
Green: Indicates that the asset is oversold (RSI below the user-defined oversold level).
How to Use the RSI Overlay Table Script
Input Tickers: Enter up to 30 ticker symbols in the script settings. The script will automatically fetch the RSI values for each ticker and display them in the overlay table on the chart.
Adjust RSI Settings: Modify the RSI length and the overbought/oversold levels according to your trading strategy. These settings can be adjusted in the script input panel.
Use the Hide Neutral Rows Option: Toggle the “Hide Neutral Rows” option to focus only on tickers that are in overbought or oversold conditions. This feature is useful for traders who wish to filter out less significant signals and only act on strong RSI indicators.
Interpret the Table: The table will display each ticker symbol alongside its current RSI value. Tickers with RSI values above the overbought level will be highlighted in red, suggesting a potential sell signal. Tickers with RSI values below the oversold level will be highlighted in green, indicating a potential buy signal.
Application and Strategy
The RSI Overlay Table script is designed for traders who manage multiple assets and need to monitor their technical indicators efficiently. It is particularly useful for:
Swing Traders: Identifying overbought and oversold conditions to time entries and exits.
Portfolio Managers: Monitoring the relative strength of various assets in a portfolio.
Scalpers: Quickly spotting extreme price movements across multiple assets.
Notes
This script is intended to be used as a supplementary tool for technical analysis. Always use it in conjunction with other indicators and market analysis techniques.
The RSI values and signals provided by this script should not be taken as financial advice.
The RSI Overlay Table script provides a clear and efficient way to track RSI values across multiple assets, helping traders make more informed decisions. By offering customizable settings and a clean, color-coded interface, this tool aims to enhance the user's trading experience and streamline their analysis process.

Dual RSI Differential - Strategy [presentTrading]█ Introduction and How it is Different
The Dual RSI Differential Strategy introduces a nuanced approach to market analysis and trading decisions by utilizing two Relative Strength Index (RSI) indicators calculated over different time periods. Unlike traditional strategies that employ a single RSI and may signal premature or delayed entries, this method leverages the differential between a shorter and a longer RSI. This approach pinpoints more precise entry and exit points, providing a refined tool for traders to exploit market conditions effectively, particularly in overbought and oversold scenarios.
Most important: it is a good eductional code for swing trading.
For beginners, this Pine Script provides a complete function that includes crucial elements such as holding days and the option to configure take profit/stop loss settings:
- Hold Days: This feature ensures that trades are not exited too hastily, helping traders to ride out short-term market volatility. It's particularly valuable for swing trading where maintaining positions slightly longer can lead to capturing significant trends.
- TPSL Condition (None by default): This setting allows traders to focus solely on the strategy's robust entry and exit signals without being constrained by preset profit or loss limits. This flexibility is crucial for learning to adjust strategy settings based on personal risk tolerance and market observations.
BTCUSD 6h LS Performance
█ Strategy, How It Works: Detailed Explanation
🔶 RSI Calculation:
The RSI is a momentum oscillator that measures the speed and change of price movements. It is calculated using the formula:
RSI = 100 - (100 / (1 + RS))
Where RS (Relative Strength) = Average Gain of up periods / Average Loss of down periods.
🔶 Dual RSI Setup:
This strategy involves two RSI indicators:
RSI_Short (RSI_21): Calculated over a short period (21 days).
RSI_Long (RSI_42): Calculated over a longer period (42 days).
Differential Calculation:
The strategy focuses on the differential between these two RSIs:
RSI Differential = RSI_Long - RSI_Short
This differential helps to identify when the shorter-term sentiment diverges from longer-term trends, signaling potential trading opportunities.
BTCUSD Local picuture
🔶 Signal Triggers:
Entry Signal: A buy (long) signal is triggered when the RSI Differential exceeds -5, suggesting strengthening short-term momentum. Conversely, a sell (short) signal occurs when the RSI Differential falls below +5, indicating weakening short-term momentum.
Exit Signal: Trades are generally exited when the RSI Differential reverses past these thresholds, indicating a potential momentum shift.
█ Trade Direction
This strategy accommodates various trading preferences by allowing selections among long, short, or both directions, thus enabling traders to capitalize on diverse market movements and volatility.
█ Usage
The Dual RSI Differential Strategy is particularly suited for:
Traders who prefer a systematic approach to capture market trends.
Those who seek to minimize risks associated with rapid and unexpected market movements.
Traders who value strategies that can be finely tuned to different market conditions.
█ Default Settings
- Trading Direction: Both — allows capturing of upward and downward market movements.
- Short RSI Period: 21 days — balances sensitivity to market movements.
- Long RSI Period: 42 days — smoothens out longer-term fluctuations to provide a clearer market trend.
- RSI Difference Level: 5 — minimizes false signals by setting a moderate threshold for action.
Use Hold Days: True — introduces a temporal element to trading strategy, holding positions to potentially enhance outcomes.
- Hold Days: 5 — ensures that trades are not exited too hastily, helping to ride out short-term volatility.
- TPSL Condition: None — enables traders to focus solely on the strategy's entry and exit signals without preset profit or loss limits.
- Take Profit Percentage: 15% — aims for significant market moves to lock in profits.
- Stop Loss Percentage: 10% — safeguards against large losses, essential for long-term capital preservation.

Rocket RSI from John EhlersWhat is Rocket RSI
Welles Wilder's original description of the relative strength index (RSI) in his 1978 New Concepts In Technical Trading Systems specified a calculation period of 14 days. This requirement led him on a 40-year quest to find the right length of data for calculating indicators and trading strategy rules. Many technicians touched on RSI and explained its applications. In this study we will obtain a more flexible and easier to interpret formulation (of the indicator). We will also estimate the algorithm to properly handle a statistical approach to technical analysis. Start with RSI Here is the original definition of the RSI indicator:
RSI = 100 - 100 / (1 + RS)
RS = Average gain from downtime over the specified time period / Average loss from downtime over the specified time period My first observation is that the factor of 100 is insignificant. Second, there is no need for averages because we take the ratio of closes (CU) to closes (CD) and if we accumulate the wins and losses independently, the averages emerge. Therefore We will only accumulate CU and CD. He can then write the RSI equation as:
RSI = 1 – 1 / (1 + CU / CD)
If he use a little algebra to put everything on a common denominator on the right side of the equation, the indicator equation becomes:
RSI = CU / (CU + CD)
In this formulation, if CU accumulation is zero, the RSI value is zero, and if CD accumulation is zero, the RSI value is 1. If you reduce the price action to its primitive level as a sine wave, it is easy to see that this RSI only has CU going from valley to peak and only CD going from peak to valley. This RSI follows the shape of the sine wave between these two limits. However, the sine wave oscillates between -1 and +1, not between 0 and +1. If we multiply the above equation by 2 and then subtract 1, we can make the RSI have the same swing limits as the sine wave. the product is as follows:
RSI = 2*CU / (CU + CD) – 1
Again, using a little algebra to put the right-hand side of the equation on a common denominator, the equation develops like this:
MyRSI = (CU – CD) / (CU + CD)
Again, the vertical scale of the RocketRSI indicator is in standard deviations. For example, -2 means it is two standard deviations below the mean. Since exceeding two standard deviations in the Gaussian probability distribution occurs in only 2.4% of the results
Because we are using the momentum of the dominant cycle period, the spike where the indicator falls below -2 provides a surgically precise timing signal to enter a long position. Similarly, exceeding the +2 standard deviation level is a timing signal to exit a long position or return to a short position. Therefore using the RocketRSI indicator is relatively intuitive. The only concern is whether a dominant cycle is present in the data, setting the indicator to half the dominant cycle period, and whether smoothing causes lag.
DETERMINING CYCLICAL TURNING POINTS
When you insert the chart you see an example of what the RocketRSI indicator looks like. Here you see that RocketRSI precisely displays cyclical turning points as statistical events. Cator can be applied. I used RS Length 10 because according to Ehlers, stocks and stock indexes usually have a more or less monthly cycle (about 20 bars). A cursory examination of Figure 2 shows that negative increases in the indicator correspond to excellent buying opportunities, while positive increases correspond to excellent selling opportunities. Exceeding +/- 2 on the indicator scale indicates that a cyclical reversal is a high probability event.

Machine Learning Momentum Index (MLMI) [Zeiierman]█ Overview
The Machine Learning Momentum Index (MLMI) represents the next step in oscillator trading. By blending traditional momentum analysis with machine learning, MLMI delivers a potent and dynamic tool that aligns with the complexities of modern financial landscapes. Offering traders an adaptive way to understand and act on market momentum and trends, this oscillator provides real-time insights into market momentum and prevailing trends.
█ How It Works:
Momentum Analysis: MLMI employs a dual-layer analysis, utilizing quick and slow weighted moving averages (WMA) of the Relative Strength Index (RSI) to gauge the market's momentum and direction.
Machine Learning Integration: Through the k-Nearest Neighbors (k-NN) algorithm, MLMI intelligently examines historical data to make more accurate momentum predictions, adapting to the intricate patterns of the market.
MLMI's precise calculation involves:
Weighted Moving Averages: Calculations of quick (5-period) and slow (20-period) WMAs of the RSI to track short-term and long-term momentum.
k-Nearest Neighbors Algorithm: Distances between current parameters and previous data are measured, and the nearest neighbors are used for predictive modeling.
Trend Analysis: Recognition of prevailing trends through the relationship between quick and slow-moving averages.
█ How to use
The Machine Learning Momentum Index (MLMI) can be utilized in much the same way as traditional trend and momentum oscillators, providing key insights into market direction and strength. What sets MLMI apart is its integration of artificial intelligence, allowing it to adapt dynamically to market changes and offer a more nuanced and responsive analysis.
Identifying Trend Direction and Strength: The MLMI serves as a tool to recognize market trends, signaling whether the momentum is upward or downward. It also provides insights into the intensity of the momentum, helping traders understand both the direction and strength of prevailing market trends.
Identifying Consolidation Areas: When the MLMI Prediction line and the WMA of the MLMI Prediction line become flat/oscillate around the mid-level, it's a strong sign that the market is in a consolidation phase. This insight from the MLMI allows traders to recognize periods of market indecision.
Recognizing Overbought or Oversold Conditions: By identifying levels where the market may be overbought or oversold, MLMI offers insights into potential price corrections or reversals.
█ Settings
Prediction Data (k)
This parameter controls the number of neighbors to consider while making a prediction using the k-Nearest Neighbors (k-NN) algorithm. By modifying the value of k, you can change how sensitive the prediction is to local fluctuations in the data.
A smaller value of k will make the prediction more sensitive to local variations and can lead to a more erratic prediction line.
A larger value of k will consider more neighbors, thus making the prediction more stable but potentially less responsive to sudden changes.
Trend length
This parameter controls the length of the trend used in computing the momentum. This length refers to the number of periods over which the momentum is calculated, affecting how quickly the indicator reacts to changes in the underlying price movements.
A shorter trend length (smaller momentumWindow) will make the indicator more responsive to short-term price changes, potentially generating more signals but at the risk of more false alarms.
A longer trend length (larger momentumWindow) will make the indicator smoother and less responsive to short-term noise, but it may lag in reacting to significant price changes.
Please note that the Machine Learning Momentum Index (MLMI) might not be effective on higher timeframes, such as daily or above. This limitation arises because there may not be enough data at these timeframes to provide accurate momentum and trend analysis. To overcome this challenge and make the most of what MLMI has to offer, it's recommended to use the indicator on lower timeframes.
-----------------
Disclaimer
The information contained in my Scripts/Indicators/Ideas/Algos/Systems does not constitute financial advice or a solicitation to buy or sell any securities of any type. I will not accept liability for any loss or damage, including without limitation any loss of profit, which may arise directly or indirectly from the use of or reliance on such information.
All investments involve risk, and the past performance of a security, industry, sector, market, financial product, trading strategy, backtest, or individual's trading does not guarantee future results or returns. Investors are fully responsible for any investment decisions they make. Such decisions should be based solely on an evaluation of their financial circumstances, investment objectives, risk tolerance, and liquidity needs.
My Scripts/Indicators/Ideas/Algos/Systems are only for educational purposes!

Improved Scalping Consolidation and Squeeze IndicatorThe Improved Scalping Consolidation and Squeeze Indicator (Improved Scalp C&S) is a custom TradingView indicator designed for short-term trading, specifically scalping. It detects price consolidation and potential breakout scenarios using a combination of technical analysis tools, such as the Rate of Change (ROC), Relative Strength Index (RSI), Moving Average Convergence Divergence (MACD), Bollinger Bands, and Keltner Channels. To reduce the number of false signals, this improved version introduces a "consolidation strength" parameter, which represents the minimum number of consecutive bars required for a valid consolidation or squeeze signal.
How it works:
Consolidation Detection:
The indicator identifies price consolidation when the following conditions are met:
a. RSI is between 45 and 55, indicating a lack of strong momentum.
b. The absolute value of the MACD histogram is less than 0.1% of the closing price, suggesting a lack of directional movement.
c. The Rate of Change (ROC) is less than 1.5%, indicating relatively stable prices over the specified period.
Squeeze Detection:
The indicator detects a squeeze (a potential breakout scenario) when the Bollinger Bands are within the Keltner Channels, represented by the following conditions:
a. The lower Bollinger Band is above the lower Keltner Channel.
b. The upper Bollinger Band is below the upper Keltner Channel.
Consolidation Strength:
The consolidation strength parameter filters out weaker signals by requiring a minimum number of consecutive bars for a valid consolidation or squeeze signal. By adjusting this parameter, traders can control the sensitivity of the indicator to short-term price movements and potentially reduce the number of false signals.
When the consolidation strength criteria are met, the indicator colors the price bars within the pattern yellow for consolidation and orange for a squeeze, signaling potential trading opportunities.
Trading Strategy:
The Improved Scalping Consolidation and Squeeze Indicator can be used in various ways, depending on the trader's strategy and risk appetite. Here are some suggestions:
Range trading: During consolidation (yellow bars), traders can buy at support levels and sell at resistance levels within the range, using stop-loss orders to manage risk. However, this approach might not work well in the case of a sudden breakout.
Breakout trading: When a squeeze is detected (orange bars), traders can wait for a confirmed breakout from the consolidation pattern before entering a trade. A breakout can be confirmed by a strong price move accompanied by increased volume, a significant change in momentum, or a breach of important support or resistance levels.
Momentum-based strategies: Traders can use other momentum-based indicators (e.g., Stochastic Oscillator, On Balance Volume) in conjunction with the Improved Scalp C&S indicator to identify potential entry and exit points during consolidation or breakout scenarios.
Fine-tuning the consolidation strength: Adjust the "consolidation strength" input to find the optimal balance between the number of signals and their accuracy. A higher value will result in fewer signals, potentially reducing the number of false signals, but it may also make the indicator less sensitive to short-term price movements.

Multi indicators tableThis is a comprehensive trading tool that presents an overview of the market in a tabular format. It consists of five distinct categories of trading indicators : Volatility, Trend, Momentum, Reversal, and Volume. Each category includes a series of indicators that are widely used in the trading communauty.
The Volatility category includes the Average True Range (ATR) and Bollinger Bands indicators. The Trend category comprises the Average Directional Index (ADX), four Exponential Moving Averages (EMAs), Aroon, Parabolic SAR, and the Supertrend. The Momentum category includes the Stochastic Relative Strength Index (StochRSI), Money Flow Index (MFI), Williams %R, Relative Strength Index (RSI), and Commodity Channel Index (CCI). The Reversal category includes Parabolic SAR, Moving Average Convergence Divergence (MACD), and PP Supertrend. Finally, the Volume category includes the Volume Exponential Moving Average (EMA) indicator.
The indicators states are easily readable, the indicator case is colored based on his actual state. A bullish color (green by default), a bearish color (red by default),
a very bullish color (dark green by default), a very bearish color (dark red by default) and a neutral color (gray by default) displayed when the indicator doesn't give us a clear signal. Some indicators do not have a very bullish or very bearish state. Concerning volatility indicators, the bullish color indicates high volatility, the bearish color indicates low volatility, and the neutral color indicates normal volatility.
Most of the indicators displayed in the table are customizable, and traders can choose to hide the categories they don't want to use. The Indicator provides a quick and easily readable view on the market and allows traders to reduce the number of indicators on their chart making it lighter and more readable.

Logistic RSI, STOCH, ROC, AO, ... by DGTExperimental attemt of applying Logistic Map Equation for some of widly used indicators.
With this study "Awesome Oscillator (AO)", "Rate of Change (ROC)", "Relative Strength Index (RSI)", "Stochastic (STOCH)" and a custom interpretation of Logistic Map Equation is presented
Calculations with Logistic Map Equation makes sense when the calculated results are iterated many times within the same equation.
Here is the Logistic Map Equation : Xn+1 = r * Xn * (1 - Xn)
Where, the value of r is the key for this equation which changes amazingly the behaviour of the Logistic Map.
The value we have asigned for r is less then 1 and greater than 0 ( 0 < r < 1) and in this case the iterations performed with the maximum number of output series allowed by Pine is quite enough for our purpose and thanks to arrays we can easiliy store them for further processing
What we have as output:
Each iteration result is then plotted (excluding plotting the first iteration), as circles or line based on user preference
Values above and below zero level (0) are coloured differently to emphasis bull and bear power
Finally Standard Deviation of Array's Elements is ploted as line. Users may choose to display this line only
So where it comes the indicators "Awesome Oscillator (AO)", "Rate of Change (ROC)", "Relative Strength Index (RSI)", "Stochastic (STOCH)".
Those are the indicators whose values are assigned to our key varaiable in the Logistic Map equation forulma which is r
Further details regarding Logistic Map can found under the description of “Logistic EMA w/ Signals by DGT” study
Disclaimer:
Trading success is all about following your trading strategy and the indicators should fit within your trading strategy, and not to be traded upon solely
The script is for informational and educational purposes only. Use of the script does not constitute professional and/or financial advice. You alone have the sole responsibility of evaluating the script output and risks associated with the use of the script. In exchange for using the script, you agree not to hold dgtrd TradingView user liable for any possible claim for damages arising from any decision you make based on use of the script

Free Stock ScreenerMissing great trade opportunities is annoying, and unless you have 12 screens or only trade one market, you are missing a lot of trades. To fix that, we created this free stock screener so you get notified instantly of potential great trading conditions in real time, right on your chart.
You get notified of trading benchmarks being met by the value being displayed on the scanner as well as a color change so that it grabs your attention and makes you aware that you should take a look at the other market and look for a potential trade. It also has built in alerts so you can have an alert notification go off when any of your trading conditions are met instead of needing to watch the scanner for color changes.
The screener will change the ticker symbol background color to red green when price is above or below the previous daily range and above or below both VWAPs. This signals that the ticker is trending, which typically means it is a great time to trade that market and follow the trend.
This free stock screener allows you to scan up to 10 different markets at the same time for various different conditions so you always know what is going on with your favorite trading symbols. If you want to scan more tickers, just add the indicator to your chart again and change the table position to the other side of the screen and update the tickers on the 2nd screener, allowing you to have 20 tickers at a time.
The scanner can be fully customized by changing the markets that it screens and turning on or off as many of them as you would like. You can also turn on or off any of the different data sets so that you only get information about trading conditions that matter to you.
The screener can provide data on any type of market, such as stocks, crypto, futures, forex and more. Each ticker can be adjusted to whatever market you would like it to scan for data in the settings panel, the only limitation is that it will not provide data for the VWAP and volume trend score if the ticker you are screening does not provide volume data.
Screener Features
The scanner will provide the following types of data for each ticker that is turned on:
Volume - Provides a volume score compared to the average volume and notifies you of higher than normal volume and volume spikes on individual bars by changing colors.
Volatility - Provides a volatility score compared to the average volatility and notifies you of higher than normal volatility by changing colors.
Oscillator - Choose between the RSI or CCI. The value of that oscillator will be displayed and will notify you when values are in extreme ranges such as overbought or oversold conditions according to the threshold values you enter in the settings panel. When those thresholds have been breached, you will be notified by it changing color.
Big Candles - Compares the current candle to average previous candle sizes, and changes color to notify you of big candles including a big top wick, big bottom wick, big candle body and big candle high to low range.
Daily Level Touches & Trends - Calculates and displays various daily candle and intraday open price levels that act as support and resistance. Notifies you when price is touching any of the daily levels that are turned on. The levels you can have on are as follows: previous day high, previous day low or previous day open. It also will notify you when price is touching the current day’s open, NY 930am open, Asia 8pm open, London 2am open and NY midnight 12am open. It will also say “Above” if price is above the previous day’s high or it will say “Below” if price is below the previous day’s low. The color of the cell will also change when a level touch is happening or price is above the previous day high or below the previous day low.
VWAP - Choose from 2 different VWAP lengths, default settings are daily and weekly VWAPs. You will get notified if price touches either of the VWAPs and they will also say “Above” or “Below” if price is currently above or below each VWAP.
How To Use The Screener To Help You Trade
The main purpose of the screener is to scan other markets and notify you of potential good trading opportunities such as price bouncing off of the daily levels or VWAPs. It can also be used to know when price is trending according to the VWAPs and daily levels. Lastly, you can use it to know how the volume and volatility trends are currently which gives you more confidence in taking a trade with this data when volume and volatility are present.
Volume Score
When volume is high, this represents a good time to trade because there are many market participants and price is likely to be volatile while there is high volume which can present a lot of good trade setups for you to take.
The volume score shown on the screener measures the current volume trend compared to previous volume trends and calculates that into a score based on 100 being the same as the previous volume trend. So any value above 100 means it is high volume and any value less than 100 means it is lower volume than normal.
In the settings panel, you can adjust the volume threshold that needs to be met for a volume notification to show up. The default setting is at 120, so you will get notified when the current volume trend score is 120 or higher or you can adjust that threshold value to whatever value you prefer.
It also will notify you when there is a volume spike on the current bar. This is determined by calculating an average of the recent volume totals and then checking to see if the current bar is greater than or equal to that average multiplied by 3. So if a single bar has volume that is greater than 3 times what the average volume is, then you will get a notification that says “Spike” to make you aware of that volume spike.
The volume trend threshold, volume spike multiplier and lookback length for the average volume used in volume spike calculations can all be adjusted in the settings panel to fit your desired preferences.
Volatility Score
High volatility can mean it is a great time to trade because the market is moving quickly and providing large enough movements that you can get in and out in a short amount of time, while still accruing decent sized trade PnL.
The volatility score will calculate the current volatility for each market compared to previous conditions and then divide the current volatility by the average volatility to give you a volatility score. Anything over 100 means the market is decently volatile and you should look at that market to find potential trade setups to execute on. Anything below 100 means the market is not very volatile and it is usually best to just wait until volatility returns before you start trading again.
The screener will notify you when the volatility score is above the threshold you set. The default value is set to 90, but can be adjusted to your preference. Pay attention to any market that shows an alert and take a look at that chart because the high volatility may present a good trade setup for you in the near future.
Oscillator Score
The oscillator data can be switched between Relative Strength Index(RSI) and Commodity Channel Index(CCI).
The RSI provides a value between 0 and 100 that indicates the momentum and strength of the recent price action. Many traders use the extremes of the 0-100 range to signal overbought or oversold conditions and use that as a sign to look for price to reverse in the near future. The typical values used for this and the default settings to provide notifications are: 70 for overbought and 30 for oversold. The scanner will notify you when the RSI value is considered overbought or oversold so you know to take a look at the chart and analyze if it is ready for a trade to be taken.
The CCI provides a value that can be used to determine the trend strength of the underlying asset when the oscillator moves above 100 or below -100. These extreme values are outside of the normal accumulation range and signify that price is moving strongly in that direction so it may be a good time to take a trade in the direction of the trend. The scanner will show you the value of the CCI for each market and notify you if that value is above 100 or below -100.
Both RSI and CCI settings can be adjusted in the settings panel to your desired settings so you have the exact oscillator settings you prefer to use as well as the exact values that you want to use for being notified.
Big Candles
Big candles can mean that many traders are buying or selling at the same time and many times indicate a good signal to trade in that same direction. That is why we included this calculation in the screener, so you are always aware when a large candle prints.
It calculates the average size of the recent candles and then uses that average as the benchmark to determine if the current candle is considered big and worthy of notifying you to take a look at that chart.
You can adjust the multiplier used for the big candle threshold to whatever you desire, but the default setting is 3 which means the candle will be considered big and notify you if it is 3 times as large as an average candle.
The big candles data will track the following candle values and notify you with these labels:
High to Low candle size = HL
Candle Body from open to close candle size = OC
Top Wick size = TW
Bottom Wick size = BW
Daily Level Touches & Trend
Daily level touches are excellent levels to watch for price to bounce because they often act as support and resistance levels for intraday trading. The scanner will track each market and notify you when the current candle is touching any of the daily levels that you have turned on in the settings panel.
The main levels that are turned on by default and are useful for all markets and how they will be labeled on the scanner are as follows:
Previous Day High = High
Previous Day Low = Low
Previous Day Open = < Open
Previous Day Close = Close
Current Day Open = Open
We also included some extra levels that are useful for futures traders. They are as follows:
NY 930am Open = 930am
NY 12am Midnight Open = 12am
Asia Open at 8pm NY time = Asia
London Open at 2am NY Time = London
Watch how price reacts to these levels and then trade the bounces off of these levels if the price action confirms that it is going to respect that level.
When price is currently above the previous day high, the scanner will say “Above” and show a green color, indicating a bullish trend and that price is above the previous daily candle’s high.
When price is currently below the previous day low, the scanner will say “Below” and show a red color, indicating a bearish trend and that price is below the previous daily candle’s low.
Pay attention to when price is trending above or below the previous daily candle as those trends can provide excellent trend trading opportunities.
The daily levels that you have turned on in the settings will also show as lines on the chart and include a label next to them, identifying each level so you know what each line represents. You can turn on or off all of the lines shown on the chart in the main settings or turn them off one by one in the style panel of the settings. Labels can also be turned on or off for all of the lines in the main settings panel. You can adjust the label positioning in the Label Offset section of the settings panel.
VWAP Touches & Trend
VWAP stands for volume weighted average price and is a very popular tool that traders use to determine trend direction based on volume as well as an excellent level to trade price bounces off of.
The typical VWAP time period used is Daily, which means the volume weighted average price will reset at the beginning of a new day. We set the first VWAP to be the daily VWAP by default and the second one to be the weekly VWAP. You can adjust both of the time periods to be any of the provided time lengths that you choose.
The screener will show “Above” with a green background color when price is above the VWAP, indicating a bullish trend. It will show “Below” with a red background color when price is below the VWAP, indicating a bearish trend. When both VWAPs are showing Above or Below, you can expect price to trend in that direction, so look for pullbacks you can trade in the direction of the trend. If the VWAPs are showing different directions, then you should expect to bounce back and forth between the VWAPs, but be careful and watch out for price to break beyond either one and start a trend.
When the current candle is touching the VWAP, the scanner will change colors and say VWAP to notify you that price is touching the VWAP and you should look at that chart and analyze the market for a potential bounce off of the VWAP to trade.
Trending Market Signals
Strong trends are excellent markets to trade and can many times provide excellent trading opportunities that don’t require expert price action reading skills to be able to take winning trades from. That is why we included a signal to notify you of a strong trending market.
The strong trending market will show up as a green or red background color for the ticker name. If the color of the ticker name is green, it is notifying you that the price is above the previous daily high, above VWAP 1 and above VWAP 2 and is a good market to look for bullish trend trades. If the color of the ticker name is red, it is notifying you that the price is below the previous daily low, below VWAP 1 and below VWAP 2 and is a good market to look for bearish trend trades.
Changing The Tickers It Scans
To change the tickers that the indicator scans, scroll near the bottom of the settings panel and select the ticker symbol you want to update and then search for the exact symbol you want to use. If you want to scan less tickers, then just turn some of the tickers off that you don’t need.
Scanning More Than 10 Tickers
If you want to scan more than 10 tickers, you can add the scanner to your chart again and then just change the table position to the other side of the screen. This will allow you to scan 10 more tickers that will show up separately. Then if you want even more, just add the indicator to your chart again and update the table position until you have as many markets as you want. The table position setting can be found at the bottom of the main settings panel.
Alerts
The screener has alerts that can be used to notify you when any of the data set thresholds have been met or if price is touching one of the levels. You can set alerts for the following events:
Bullish Trend Alert - Price is above the previous daily high and above both VWAPs.
Bearish Trend Alert - Price is below the previous daily low and below both VWAPs.
High Volume Alert - Volume is higher than the threshold or a volume spike is detected.
High Volatility Alert - Volatility is higher than the threshold.
Oscillator Is Extended Alert - Oscillator value has exceeded the upper or lower threshold.
Big Candle Alert - A big candle has been detected.
Daily Level Touch Alert - One of the daily levels that is turned on is being touched.
VWAP Touch Alert - One of the 2 VWAPs are being touched.
An alert will trigger when any one of tickers on your scanner meets the alert conditions, so when you see the alert, you will need to go to your chart and look at the scanner to see which ticker it was and then navigate to that chart to look for potential trade setups.
The alerts will use the exact same settings you have configured in the settings panel to send you alert notifications. With normal settings, this could give you a lot of alerts, so if you only want alerts to fire when abnormal conditions are being met, try setting up a second screener on your chart that has very high threshold values and only has the most important level touches on. Then turn the setting "Do Not Show The Screener On The Chart" to off so the calculations will still run and fire alerts, but won't clog up your charts. This way you can only get alert notifications when major events happen but still have your normal screener settings available on your chart.
Markets This Can Be Used On
This screener uses the price action and volume data so you can use it to scan any type of market you would like as long as the ticker you are scanning has price and volume data feeds. If a market does not have volume data, then it will just show NaN in the volume row and the VWAP rows will not show anything.

RSI Dynamic Bands█ OVERVIEW
The "RSI Dynamic Bands" indicator is a variant of the Relative Strength Index (RSI) oscillator that brings its signals directly onto the price chart. It displays dynamic bands around the price, adjusted based on RSI levels, enabling easy identification of potential overbought or oversold conditions. The indicator also integrates a multi-timeframe RSI table, facilitating the analysis of trend strength across different timeframes.
█ CONCEPTS
The "RSI Dynamic Bands" indicator is designed to simplify the interpretation of price levels in the context of support and resistance zones, which can be correlated with other technical indicators and RSI values. Since the price itself does not display RSI values, a table showing RSI for four selected timeframes has been added, allowing traders to quickly assess trend strength across different time intervals. The most effective approach is to combine the indicator with other technical analysis tools, such as Fibonacci levels or pivot points, to confirm signals when the price approaches the bands and RSI values indicate a potential reversal.
Band Calculation
The bands are calculated based on the current closing price and RSI values, incorporating dynamic scaling to better adapt to market conditions. The formulas for the bands are as follows:
• Upper Band: close + (rsiUpper - rsi) * scaleFactor, where rsiUpper is the upper RSI level (default: 70), and scaleFactor accounts for market volatility.
• Lower Band: close + (rsiLower - rsi) * scaleFactor, where rsiLower is the lower RSI level (default: 30).
• Midline: The arithmetic average of the upper and lower bands: (upperBand + lowerBand) / 2.
Why Scaling? Without scaling, the bands would be chaotic and jagged, making them difficult to interpret. Scaling smooths the bands, making them wider during periods of high volatility and narrower during consolidation, better reflecting potential support and resistance levels.
Indicator Features
• Dynamic Price Bands: The bands adapt to market conditions, facilitating the identification of key price levels.
• Multi-Timeframe RSI Table: Displays RSI values for four selected timeframes (default: 15m, 1h, 4h, Daily), enabling comparison of trend strength across different perspectives.
• Style Customization: Users can adjust band colors, line thickness, and toggle the visibility of bands, fills, and the table.
How to Set Up the Indicator
1 — Add the "RSI Dynamic Bands" indicator to your TradingView chart.
2 — Configure parameters in the settings, such as RSI length, upper/lower levels, and scaling multiplier, to match your trading style.
3 — Enable or disable the display of bands, fills, or the RSI table based on your needs.
4 — Adjust band and table colors in the input section and line thickness in the "Style" section to better align the indicator with your chart.
█ OTHER SECTIONS
FEATURES
• RSI Length: The period for calculating RSI (default: 14).
• RSI Levels: Thresholds for overbought (default: 70) and oversold (default: 30).
• Scaling Multiplier: Adjusts bands based on market volatility (default: 0.15).
• Table Timeframes: Select four timeframes for the RSI table (default: 15m, 1h, 4h, Daily).
• Style Options: Customize band colors, fills, table, and line thickness.
HOW TO USE
Add the indicator to your chart, configure the parameters, and observe price interactions with the bands to identify potential entry and exit points. The RSI table allows you to compare RSI values across different timeframes, aiding in trading decisions. The most effective approach is to combine the indicator with other technical analysis tools, such as Fibonacci levels or pivot points, to confirm signals when the price approaches the bands and RSI values indicate a potential reversal.
Trading Strategies:
• Scalping: Use lower timeframes (e.g., 5m, 15m) in the RSI table to quickly identify short-term lows and highs. Wait for the price to approach the lower band in the RSI oversold zone, with RSI on lower timeframes starting to rise, and other tools, such as Fibonacci levels (e.g., 38.2%) or pivot points, confirming support.
• Medium-Term Trading: Focus on 1h and 4h timeframes. Look for confirmation of a low on a lower timeframe (e.g., 1h), where RSI indicates oversold conditions or starts rising, then check if RSI on a higher timeframe (e.g., 4h) confirms the trend. Confirmation from other tools, such as a Fibonacci level (e.g., 50%) or pivot point near the bands, strengthens the signal.
• Long-Term Trading: Use Daily and higher timeframes (e.g., Weekly). Wait for all relevant timeframes to confirm a low (e.g., RSI near oversold and price at the lower band), with lower timeframes (e.g., 4h) showing rising RSI. Other tools, such as Fibonacci levels (e.g., 61.8%) or pivot points near the bands, can further confirm a trend reversal signal.

RSI Multi-Timeframe Dashboard by giua64)### Summary
This is an advanced dashboard that provides a comprehensive overview of market strength and momentum, based on the Relative Strength Index (RSI) analyzed across 6 different timeframes simultaneously (from 5 minutes to the daily chart).
The purpose of this script is to offer traders an immediate and easy-to-read summary of market conditions, helping to identify the prevailing trend direction, overbought/oversold levels, and potential reversals through divergence detection. All of this is available in a single panel, eliminating the need to switch timeframes on your main chart.
### Key Features
* **Multi-Timeframe Analysis:** Simultaneously monitors the 5m, 15m, 30m, 1H, 4H, and Daily timeframes.
* **Scoring System:** Each timeframe is assigned a score based on multiple RSI conditions (e.g., above/below 50, overbought/oversold status, direction) to quantify bullish or bearish strength.
* **Aggregated Signal:** The dashboard calculates a total percentage score and provides a clear summary signal: **LONG**, **SHORT**, or **WAIT**.
* **Divergence Detection:** Automatically identifies Bullish and Bearish divergences between price and RSI for each timeframe.
* **Non-Repainting Option:** In the settings, you can choose to base calculations on the close of the previous candle (`Use RSI on Closed Candle`). This ensures that past signals (like status and score) do not change, providing more reliable data for analysis.
* **Fully Customizable:** Users can modify the RSI period, overbought/oversold thresholds, divergence detection settings, and the appearance of the table.
### How to Read the Dashboard
The table consists of 6 columns, each providing specific information:
* **% (Total Score):**
* **Header:** Shows the overall strength as a percentage. A positive value indicates bullish momentum, while a negative value indicates bearish momentum. The background color changes based on intensity.
* **Rows:** Displays the numerical score for the individual timeframe.
* **RSI:**
* **Header:** The background color indicates the average of all RSI values. Green if the average is > 50, Red if < 50.
* **Rows:** Shows the real-time RSI value for that timeframe.
* **Signal (Status):**
* **Header:** This is the final operational signal. It turns **🟢 LONG** when bullish strength is high, **🔴 SHORT** when bearish strength is high, and **⚪ WAIT** in neutral conditions.
* **Rows:** Describes the RSI status for that timeframe (e.g., Bullish, Bearish, Overbought, Oversold).
* **Dir (Direction):**
* **Header:** Displays an arrow representing the majority direction across all timeframes.
* **Rows:** Shows the instantaneous direction of the RSI (↗️ for rising, ↘️ for falling).
* **Diverg (Divergence):**
* Indicates if a bullish (`🟢 Bull`) or bearish (`🔴 Bear`) divergence has been detected on that timeframe.
* **TF (Timeframe):**
* Indicates the reference timeframe for that row.
### Advantages and Practical Use
This tool was created to solve a common problem: the need to analyze multiple charts to understand the bigger picture. With this dashboard, you can:
1. **Confirm a Trend:** A predominance of green and a "LONG" signal provides strong confirmation of bullish sentiment.
2. **Identify Weakness:** Red signals on higher timeframes can warn of an impending loss of momentum.
3. **Spot Turning Points:** A divergence on a major timeframe can signal an excellent reversal opportunity.
### Originality and Acknowledgements
This script is an original work, written from scratch by giua64. The idea was to create a comprehensive and visually intuitive tool for RSI analysis.
Any feedback, comments, or suggestions to improve the script are welcome!
**Disclaimer:** This is a technical analysis tool and should not be considered financial advice. Always do your own research and backtest any tool before using it in a live trading environment.
Script open-source
In pieno spirito TradingView, il creatore di questo script lo ha reso open-source, in modo che i trader possano esaminarlo e verificarne la funzionalità. Complimenti all'autore! Sebbene sia possibile utilizzarlo gratuitamente, ricorda che la ripubblicazione del codice è soggetta al nostro Regolamento.
giua64
borsamercati.it – Educational tools by giua64
Anche su:
Declinazione di responsabilità
Le informazioni ed i contenuti pubblicati non costituiscono in alcun modo una sollecitazione ad investire o ad operare nei mercati finanziari. Non sono inoltre fornite o supportate da TradingView. Maggiori dettagli nelle Condizioni d'uso.

Fibonacci ReRSI LevelsOverview
The Fibonacci RSI Levels indicator plots key Fibonacci-based RSI levels directly on the price chart, offering a unique perspective on market momentum, potential reversal points, and support/resistance zones. By combining the Relative Strength Index (RSI) with Fibonacci retracement levels, this indicator helps traders identify overbought/oversold conditions, trend strength, and critical price levels for potential trading opportunities.
Key Features
Fibonacci RSI Levels: Plots five key levels—23.6% (Oversold), 38.2% (Downtrend Limit), 50.0% (Mid Level), 61.8% (Uptrend Limit), and 78.6% (Overbought)—based on a logarithmic RSI calculation.
Customizable Settings: Adjust the RSI length, line extension, timeframe, and level colors to suit your trading style.
Gradient Fills: Optional gradient fills between levels provide a visual representation of the price's position relative to key zones.
Multi-Timeframe Support: Use the current chart resolution or specify a custom timeframe (e.g., 1M, 5D, 240 for 4 hours) for flexible analysis.
Logarithmic RSI Calculation: Ideal for assets with exponential price movements, such as cryptocurrencies.
How It Works
The indicator uses a reverse-engineered RSI calculation, inspired by Giorgos Siligardos' concept, to determine price levels corresponding to specific Fibonacci RSI values. These levels are plotted as horizontal lines on the chart, each with a label showing the Fibonacci percentage and the exact price level. If enabled, gradient fills between the levels change color based on the price's position, enhancing visual interpretation.
Usage
Support and Resistance: The 38.2% and 61.8% levels often act as support and resistance in trending markets.
Overbought/Oversold Conditions: The 23.6% and 78.6% levels can indicate potential reversal points due to oversold or overbought conditions.
Trend Confirmation: The 50% level serves as a neutral zone or pivot point. Prices above this level may indicate an uptrend, while prices below suggest a downtrend.
Gradient Fills: Use the gradient fills to quickly assess the price's position within the key zones, aiding in decision-making for entries, exits, or reversals.
Interpretation
Uptrend: When the price is above the 50% level and approaching the 61.8% level, it may signal a strong uptrend.
Downtrend: When the price is below the 50% level and nearing the 38.2% level, it may indicate a downtrend.
Reversal Zones: Watch for price reactions near the 23.6% and 78.6% levels, as these can be areas of potential reversals.
Customization
RSI Length: Adjust the RSI period to fine-tune the sensitivity of the levels.
Line Extension: Control how far the levels extend into the future for better visualization.
Timeframe: Choose between the current chart resolution or a custom timeframe for multi-timeframe analysis.
Colors: Customize the colors of each level and enable gradient fills for enhanced visual clarity.

RSI SiaThis script is a custom indicator for TradingView written in Pine Script version 5. It calculates the Relative Strength Index (RSI) and uses it to generate trading signals. Here's a breakdown of what the script does:
Key Features:
RSI Calculation:
The script calculates the RSI using a 14-period window.
It also calculates the momentum of the RSI over a 9-period window (rsi delta) and a simple moving average (SMA) of the RSI over a 3-period window (rsi sma).
Composite Index (CI):
The composite index is calculated as the sum of rsi delta and rsi sma.
Horizontal Lines and Zones:
Several horizontal lines are plotted at different levels (e.g., 20, 40, 60, 80, 120, 150, 180) to indicate overbought and oversold conditions.
Filled zones are created between certain levels to highlight areas of interest.
Moving Averages:
The script plots SMA and EMA of the RSI when Enable RSI ma is set to true.
It also plots moving averages of the composite index.
Crossover Signals:
The script detects bullish and bearish crossovers between the SMA and EMA of the RSI.
It plots shapes (labels) on the chart to indicate buy (BUY) and sell (SELL) signals based on these crossovers.
Usage:
Enable RSIma: This input allows you to enable or disable the plotting of RSI moving averages.
i1: This variable is used to adjust the vertical position of the composite index and its moving averages.
Visualization:
The RSI is plotted in black.
The RSI fast trigger line (SMA of RSI) is plotted in green when enabled.
The RSI slow trigger line (EMA of RSI) is plotted in orange when enabled.
The composite index and its moving averages are plotted in red, green, and orange.
Buy and sell signals are indicated with green and red labels, respectively.
This script can be used to identify potential trading opportunities based on RSI crossovers and the composite index.

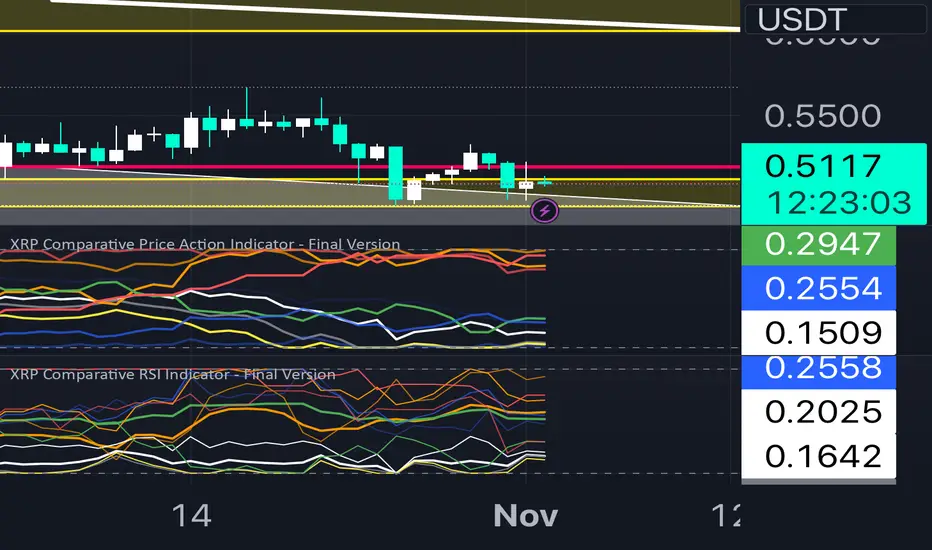
XRP Comparative RSI Indicator - Final VersionXRP Comparative RSI Indicator - Final Version
The XRP Comparative RSI Indicator offers a dynamic analysis of XRP’s market positioning through relative strength index (RSI) comparisons across various cryptocurrencies and major market indicators. This indicator allows traders and analysts to gauge XRP’s momentum and potential turning points within different market conditions.
Key Features:
• Normalized RSIs: Each RSI value is normalized between 0.00 and 1.00, allowing seamless comparison across multiple assets.
• Grouped Analysis: Three RSI groups provide specific insights:
• Group 1 (XRP-Specific): Measures XRPUSD, XRP Dominance (XRP.D), and XRP/BTC, focusing on XRP’s performance across different trading pairs.
• Group 2 (Market Influence - Bitcoin): Measures BTCUSD, BTC Dominance (BTC.D), and XRP/BTC, capturing the influence of Bitcoin on XRP.
• Group 3 (Liquidity Impact): Measures USDT Dominance (USDT.D), BTCUSD, and ETHUSD, evaluating the liquidity impact from key assets and stablecoins.
• Individual Asset RSIs: Track the normalized RSI for each specific pair or asset, including XRPUSD, BTCUSD, ETHUSD, XRP/BTC, BTC Dominance, ETH Dominance, and the S&P 500.
• Clear Color Coding: Each asset’s RSI is plotted with a unique color scheme, consistent with the first indicator, for easy recognition.
This indicator is ideal for identifying relative strengths, potential entry and exit signals, and understanding how XRP’s momentum aligns or diverges from broader market trends.
Z-Score RSI StrategyOverview
The Z-Score RSI Indicator is an experimental take on momentum analysis. By applying the Relative Strength Index (RSI) to a Z-score of price data, it measures how far prices deviate from their mean, scaled by standard deviation. This isn’t your traditional use of RSI, which is typically based on price data alone. Nevertheless, this unconventional approach can yield unique insights into market trends and potential reversals.
Theory and Interpretation
The RSI calculates the balance between average gains and losses over a set period, outputting values from 0 to 100. Typically, people look at the overbought or oversold levels to identify momentum extremes that might be likely to lead to a reversal. However, I’ve often found that RSI can be effective for trend-following when observing the crossover of its moving average with the midline or the crossover of the RSI with its own moving average. These crossovers can provide useful trend signals in various market conditions.
By combining RSI with a Z-score of price, this indicator estimates the relative strength of the price’s distance from its mean. Positive Z-score trends may signal a potential for higher-than-average prices in the near future (scaled by the standard deviation), while negative trends suggest the opposite. Essentially, when the Z-Score RSI indicates a trend, it reflects that the Z-score (the distance between the average and current price) is likely to continue moving in the trend’s direction. Generally, this signals a potential price movement, though it’s important to note that this could also occur if there’s a shift in the mean or standard deviation, rather than a meaningful change in price itself.
While the Z-Score RSI could be an insightful addition to a comprehensive trading system, it should be interpreted carefully. Mean shifts may validate the indicator’s predictions without necessarily indicating any notable price change, meaning it’s best used in tandem with other indicators or strategies.
Recommendations
Before putting this indicator to use, conduct thorough backtesting and avoid overfitting. The added parameters allow fine-tuning to fit various assets, but be careful not to optimize purely for the highest historical returns. Doing so may create an overly tailored strategy that performs well in backtests but fails in live markets. Keep it balanced and look for robust performance across multiple scenarios, as overfitting is likely to lead to disappointing real-world results.

RSI - ARIEIVhe RSI MAPPING - ARIEIV is a powerful technical indicator based on the Relative Strength Index (RSI) combined with moving averages and divergence detection. This indicator is designed to provide a clear view of overbought and oversold conditions, as well as identifying potential reversals and signals for market entries and exits.
Key Features:
Customizable RSI:
The indicator offers flexibility in adjusting the RSI length and data source (closing price, open price, etc.).
The overbought and oversold lines can be customized, allowing the RSI to signal critical market zones according to the trader’s strategy.
RSI-Based Moving Averages (MA):
Users can enable a moving average based on the RSI with support for multiple types such as SMA, EMA, WMA, VWMA, and SMMA (RMA).
For those who prefer Bollinger Bands, there’s an option to use the moving average with standard deviation to detect market volatility.
Divergence Detection:
Detects both regular and hidden divergences (bullish and bearish) between price and RSI, which can indicate potential market reversals.
These divergences can be customized with specific colors for easy identification on the chart, allowing traders to quickly spot significant market shifts.
Zone Mapping:
The script maps zones of buying and selling strength, filling the areas between the overbought and oversold levels with specific colors, highlighting when the market is in extreme conditions.
Strength Tables:
At the end of each session, a table appears on the right side of the chart, displaying the "Buying Strength" and "Selling Strength" based on calculated RSI levels. This allows for quick analysis of the dominant pressure in the market.
Flexible Settings:
Many customization options are available, from adjusting the number of decimal places to the choice of colors and the ability to toggle elements on or off within the chart.
Market Sentiment Technicals [LuxAlgo]The Market Sentiment Technicals indicator synthesizes insights from diverse technical analysis techniques, including price action market structures, trend indicators, volatility indicators, momentum oscillators, and more.
The indicator consolidates the evaluated outputs from these techniques into a singular value and presents the combined data through an oscillator format, technical rating, and a histogram panel featuring the sentiment of each component alongside the overall sentiment.
🔶 USAGE
The Market Sentiment Technicals indicator is a tool able to swiftly and easily gauge market sentiment by consolidating the individual sentiment from multiple technical analysis techniques applied to market data into a single value, allowing users to asses if the market is uptrending, consolidating, or downtrending.
The tool includes various components and presentation formats, each described in the sub-sections below.
🔹Indicators Sentiment Panel
The indicators sentiment panel provides normalized sentiment scores for each supported indicator, along with a synthesized representation derived from the average of all individual normalized sentiments.
🔹Market Sentiment Meter
The market sentiment meter is obtained from the synthesized representation derived from the average of all individual normalized sentiments. It allows users to quickly and easily gauge the overall market sentiment.
🔹Market Sentiment Oscillator
The market sentiment oscillator provides a visual means to monitor the current and historical strength of the market. It assists in identifying the trend direction, trend momentum, and overbought and oversold conditions, aiding in the anticipation of potential trend reversals.
Divergence occurs when there is a difference between what the price action is indicating and what the market sentiment oscillator is indicating, helping traders assess changes in the price trend.
🔶 DETAILS
The indicator employs a range of technical analysis techniques to interpret market data. Each group of indicators provides valuable insights into different aspects of market behavior.
🔹Momentum Indicators
Momentum indicators assess the speed and change of price movements, often indicating whether a trend is strengthening or weakening.
Relative Strength Index (RSI): Measures the magnitude of recent price changes to evaluate overbought or oversold conditions.
Stochastic %K: Compares the closing price to the range over a specified period to identify potential reversal points.
Stochastic RSI Fast: Combines features of Stochastic oscillators and RSI to gauge both momentum and overbought/oversold levels efficiently.
Commodity Channel Index (CCI): Measures the deviation of an asset's price from its statistical average to determine trend strength and overbought and oversold conditions.
Bull Bear Power: Evaluates the strength of buying and selling pressure in the market.
🔹Trend Indicators
Trend indicators help traders identify the direction of a market trend.
Moving Averages: Provides a smoothed representation of the underlying price data, aiding in trend identification and analysis.
Bollinger Bands: Consists of a middle band (typically a simple moving average) and upper and lower bands, which represent volatility levels of the market.
Supertrend: A trailing stop able to identify the current direction of the trend.
Linear Regression: Fits a straight line to past data points to predict future price movements and identify trend direction.
🔹Market Structures
Market Structures: Analyzes the overall pattern of price movements, including Break of Structure (BOS), Market Structure Shifts (MSS), also referred to as Change of Character (CHoCH), aiding in identifying potential market turning and continuation points.
🔹The Normalization Technique
The normalization technique employed for trend indicators relies on buy-sell signals. The script tracks price movements and normalizes them based on these signals.
normalize(buy, sell, smooth)=>
var os = 0
var float max = na
var float min = na
os := buy ? 1 : sell ? -1 : os
max := os > os ? close : os < os ? max : math.max(close, max)
min := os < os ? close : os > os ? min : math.min(close, min)
ta.sma((close - min)/(max - min), smooth) * 100
In this Pine Script snippet:
The variable os tracks market sentiment, taking a value of 1 for buy signals and -1 for sell signals, indicating bullish and bearish sentiments, respectively.
max and min are used to identify extremes in sentiment and are updated based on changes in os . When market sentiment shifts from buying to selling (or vice versa), max and min adjust accordingly.
Normalization is achieved by comparing current price levels to historical extremes in sentiment. The result is smoothed by default using a 3-period simple moving average. Users have the option to customize the smoothing period via the script settings input menu.
🔶 SETTINGS
🔹Generic Settings
Timeframe: This option selects the timeframe for calculating sentiment. If a timeframe lower than the chart's is chosen, calculations will be based on the chart's timeframe.
Horizontal Offset: Determines the distance at which the visual components of the indicator will be displayed from the primary chart.
Gradient Colors: Allows customization of gradient colors.
🔹Indicators Sentiment Panel
Indicators Sentiment Panel: Toggle the visibility of the indicators sentiment panel.
Panel Height: Determines the height of the panel.
🔹Market Sentiment Meter
Market Sentiment Meter: Toggle the visibility of the market sentiment meter (technical ratings in the shape of a speedometer).
🔹Market Sentiment Oscillator
Market Sentiment Oscillator: Toggle the visibility of the market sentiment oscillator.
Show Divergence: Enables detection of divergences based on the selected option.
Oscillator Line Width: Customization option for the line width.
Oscillator Height: Determines the height of the oscillator.
🔹Settings for Individual Components
In general,
Source: Determines the data source for calculations.
Length: The period to be used in calculations.
Smoothing: Degree of smoothness of the evaluated values.
🔹Normalization Settings - Trend Indicators
Smoothing: The period used in smoothing normalized values, where normalization is applied to moving averages, Bollinger Bands, Supertrend, VWAP bands, and market structures.
🔶 LIMITATIONS
Like any technical analysis tool, the Market Sentiment Technicals indicator has limitations. It's based on historical data and patterns, which may not always accurately predict future market movements. Additionally, market sentiment can be influenced by various factors, including economic news, geopolitical events, and market psychology, which may not be fully captured by technical analysis alone.

ESI (Exponential Strength Index) & SSI (Simple Strength Index)1.Exponential Strength Index (ESI) & Relative Strength Index (RSI) cross above Simple Strength Index (SSI) is buy signal and sell is below. Confirm with level
2.Use divergence confirm signal buy and sell with first method

RSI For Loop | PWRSI For Loop – True Dominance Oscillator
RSI For Loop – True Momentum Dominance Through Historical Comparison
The Relative Strength Index (RSI) is excellent at measuring recent price change intensity, but a reading of 70 or 30 has completely different implications depending on the market regime. RSI For Loop removes this ambiguity by transforming RSI into a clean, zero-centered dominance / percentile-rank oscillator that always tells you exactly how strong or weak the current momentum is compared to recent history.
How it works
- Standard RSI is calculated normally (default length 46).
- A simple for-loop compares the current RSI value against the actual RSI value of every previous bar inside the user-defined lookback window (default 1 to 99 bars ≈ one full quarter on daily charts).
- Current RSI higher → +1 point
- Current RSI lower → –1 point
The resulting score ranges from –99 to +99 and is naturally centered around zero:
1. +40 = current momentum beats ~70 % of the last 99 bars (approximation)
2. –60 = current momentum is weaker than ~80 % of the last 99 bars (approximation)
3. Near zero = balanced or ranging market
Additional statistical layers
- A very long rolling median of the score (default 240 periods) serves as a slow, robust dynamic centerline
- Upper and lower 3σ bands are calculated from the standard deviation of the underlying RSI median (default length 60) to highlight truly rare extreme-dominance phases
- Asymmetric trend thresholds (default Long +15 / Short –28) reflect the empirical observation that downside momentum is usually sharper and faster
Origin and development
The core idea of using a for-loop on RSI was originally introduced by @viResearch in his invite-only “RSI For Loop” script.
While studying that concept I realised I needed an even more regime-robust strength gauge that looks back far enough to capture full market cycles (2–4 months). Therefore I completely rewrote the loop to compare against actual historical RSI values instead of fixed levels, added a 240-period median centerline, 3σ extreme bands, asymmetric thresholds, and visual signals. All parameters were extensively tested across dozens of major assets (BTC, ETH, SOL, SUI, BNB, XRP, TRX, DOGE, LINK, PAXG, CVX, HYPE, VIRTUAL + 20+ more cryptos; Magnificent 7 stocks, QQQ, SPX, XAUUSD) with the goal of achieving consistent profitability, high Sortino ratio and low drawdown in simple trend-following setups.
The final defaults represent the most robust compromise found — they keep you in real trends for dozens or hundreds of bars while staying almost silent in choppy, ranging markets.
Important Note
The optimization process is tailored to MY needs and have to be adjusted to you prefered timeframe!
I was mainly looking for an indicator that shows the underlying strength of an asset, the trend componant was only a bonus in my eyes.
How to use it
1. Green triangle below bar → score crosses above +15 → new bullish regime confirmed → enter or add to longs
2. Magenta triangle above bar → score crosses below –28 → exit longs or go cash/short
While score stays clearly positive → bullish bias hold
3. Score touching or breaking the 3σ bands → extreme conviction zone (add to winners or prepare for exhaustion)
Strength
Recommended defaults (My preference)
RSI length 46
Loop range 1–99
Long threshold +15
Short threshold –28
Median length 240
SD length 60
Recommended Universal Settings (Tested for low Max-Drawdown, high Sortino)
RSI length 44
Loop range 1–60
Long threshold +14
Short threshold –10
Median length 180
SD length 28
Works on every asset class, but the current settings are tuned for major liquid markets.
Disclaimer: This is not financial advice. Backtests are based on past results and are not indicative of future performance.

Smart RSI Money Flow - Core Bands V1.01SMART RSI – Money Flow Bands (Technical Overview)
1. Background: RSI and Its Behavior on Lower Timeframes
The Relative Strength Index (RSI) originally is a momentum oscillator calculated from average gains and losses over a selected period. In its standard form, RSI is derived solely from price changes; it does not incorporate volume data or order-flow information in its formula.
Because RSI is price-based, its interpretation depends strongly on the timeframe:
• On higher timeframes, each bar aggregates more trading activity, and RSI tends to behave more smoothly.
• On lower timeframes (1-hour down to intraday scalping intervals), price fluctuations are quicker, and RSI becomes more sensitive to short-term noise.
This does not imply that RSI becomes invalid, but that its signals on fast charts can be more reactive and may benefit from additional context such as volume behavior or structural information.
2. Purpose of This Indicator
This indicator extends the classical RSI by adding information that RSI does not include:
• Mapping RSI values into price-based bands instead of the 0–100 oscillator space.
• Retrieving lower timeframe volume data and separating it into buy and sell components.
• Comparing the slope (angle) of price movement with the slope of buy and sell volume.
The goal is to provide a structural interpretation of where price sits relative to RSI conditions and how volume is behaving on a lower timeframe.
3. Technical Differences Compared to Classical RSI
A) Classical RSI
• Input: price only (usually close).
• Output: normalized oscillator between 0 and 100.
• Does not incorporate intra-bar volume distribution.
• Does not separate buy/sell volume.
B) SMART RSI – Money Flow Bands
1) RSI-to-Price Mapping
Converts RSI values into upper/lower price bands using recent price extremes.
2) Lower Timeframe Volume Decomposition
Retrieves LTF data and splits each bar’s volume into buy (close>open) and sell (close

Volume Weighted Relative Strength IndexThis indicator calculates the Relative Strength Index (RSI) and enhances it with optional volume weighting (VWRSI). It also includes a customizable signal line and a built-in divergence detection engine.
Key Features:
Volume-Weighted Calculation: An option (Volume weighted) allows for volume to be incorporated into the calculation of both the RSI itself and its moving average signal line, making the oscillator more sensitive to high-volume price changes.
Customizable Signal Line: Includes an optional moving average of the VWRSI, which serves as a signal line. The type of MA (Smooth Method) and its length can be customized.
Full Divergence Suite (Class A, B, C): The primary feature is the integrated divergence engine. It automatically detects and plots all three major types of divergences:
Regular (A): Signals potential trend reversals.
Hidden (B): Signals potential trend continuations.
Exaggerated (C): Signals weakness at double tops/bottoms.
Divergence Filtering and Visualization:
Price Tolerance Filter: Divergence detection is enhanced with a percentage-based price tolerance (pivPrcTol) to filter out insignificant market noise.
Persistent Visualization: Divergence markers are plotted for the entire duration of the signal and are visually anchored to the VWRSI level of the confirming pivot.
Note on Confirmation (Lag): Divergence signals rely on a pivot confirmation method to ensure they do not repaint.
The Start of a- divergence is only detected after the confirming pivot is fully formed (a delay based on Pivot Right Bars).
The End of a divergence is detected either instantly (if the signal is invalidated by price action) or with a delay (when a new, non-divergent pivot is confirmed).
Multi-Timeframe (MTF) Capability:
MTF VWRSI Line: The VWRSI and its signal line can be calculated on a higher timeframe, with standard options to handle gaps (Fill Gaps) and prevent repainting (Wait for...).
Limitation: The Divergence detection engine (pivDiv) is disabled if a timeframe other than the chart's timeframe is selected. Divergences are only calculated on the active chart timeframe.
Integrated Alerts: Includes 20 comprehensive alerts for:
The start and end of all 6 divergence types.
The VWRSI crossing its signal line.
The VWRSI crossing the Overbought, Oversold, or 50-level lines.
DISCLAIMER
For Informational/Educational Use Only: This indicator is provided for informational and educational purposes only. It does not constitute financial, investment, or trading advice, nor is it a recommendation to buy or sell any asset.
Use at Your Own Risk: All trading decisions you make based on the information or signals generated by this indicator are made solely at your own risk.
No Guarantee of Performance: Past performance is not an indicator of future results. The author makes no guarantee regarding the accuracy of the signals or future profitability.
No Liability: The author shall not be held liable for any financial losses or damages incurred directly or indirectly from the use of this indicator.
Signals Are Not Recommendations: The alerts and visual signals (e.g., crossovers) generated by this tool are not direct recommendations to buy or sell. They are technical observations for your own analysis and consideration.
